Search
Tri Setiyono, Moseley, David O, Pinnell-Alison, Carol L., Poudel, Aakriti

Tri Setiyono, Aakriti Poudel, Carol Pinnell-Alison and David Moseley
Soybean and corn growers in northeast Louisiana are concerned about adverse weather events, such as prolonged periods of rainfall, that can reduce the quality and yields of crops. LSU AgCenter researchers are studying ways to prevent these crop problems while also using precision agriculture tools to improve their assessments of the impacts from these weather events. These tools include sophisticated crop modeling software, satellite-based sensors and drone-based sensing technology. Two AgCenter studies serve as prime examples of this work.
Effects of heavy rains on soybeans
The year 2022 was particularly devastating for growers in Franklin Parish as continuous rain in August caused widespread damage to soybeans and corn. Soybean seeds sprouted out of the pod, and likewise, late-planted corn seeds sprouted on the cobs (Figure 1). The weather event affected soybeans the most because the wet spell occurred while most soybean acres were in the beginning stages of maturity, which is a stage called R7, and were beginning to dry down to full maturity before they could be harvested, which is a stage called R8. At these growth stages, continuous rain events can cause soybean seeds to rot or germinate in the pod. Approximately 18 inches of rain — a record rainfall for August — were registered through the weather station at the AgCenter Sweet Potato Research Station near Winnsboro (Figure 2). Geographic data suggested that August 2022 was unusually wet for most of northeast Louisiana (Figure 3). It was also unfortunate that in 2022, soybean acreage surged as growers switched to soybeans instead of corn because of the high price of fertilizer.
Computer modeling crop growth and satellite observations
To further investigate how this weather event affected soybeans planted in northeast Louisiana, AgCenter researchers used a computer program that predicts how crops grow — the CROPGRO model in the Decision Support System for Agrotechnology Transfer (DSSAT) software. With remote sensing data from the European Space Agency’s Sentinel-2 satellite, an analysis explained the difference between soybeans planted in the early part of the 2022 season versus those planted in late April. Plenty of rainfall occurred while early planted soybeans progressed from the R7 stage of physiological maturity to the R8 stage of full maturity where the beans dry down before harvest. However, the wet spell was very much over by the time the soybeans planted in late April reached the R7 stage of physiological maturity.
Another tool, the Enhanced Vegetation Index (EVI), uses satellite images to measure how green a crop canopy is to understand plant health. The EVI data from this period confirmed the differences between early-planted soybeans and late-planted soybeans. The drop in the index for the early planted soybeans, which indicated maturing soybeans, coincided with the frequent rain events. Such a drop for the late-planted soybeans occurred past these wet spell events.
At this time, the EVI was substantially higher for the early planted soybeans, while another tool, the Bare Soil Index (BSI), showed the reverse. The BSI uses satellite images to find bare soil and delineates soil background against surface vegetation, with a higher value indicating more soil surface exposed in the image. The early planted soybeans exhibited a lower value when compared with the late-planted fields. This example showed the early and late-planted fields compared to one another despite being located in Franklin and Catahoula parishes.
A comprehensive analysis of satellite-derived remote sensing data of major soybean landscapes in Catahoula, Franklin, Tensas and Madison parishes suggested that as much as 68%, 71%, 82% and 85% of the parishes’ soybean acreage, respectively, were affected by the widespread damage from the 2022 August wet spell. These spatial data match the 2022 Louisiana Ag Summary released by the AgCenter, which found that only 20% of the soybean crop was rated as good to excellent.
LSU AgCenter scientists have been conducting research trials on soybean desiccants, which are herbicides or other drying agents that improve harvest efficiency. Important studies include those that examine the impact of desiccant application timing on soybean yield and quality. However, interventions that may come out of soybean desiccant studies as potential preventive measures against adverse weather conditions like the August 2022 rains will need to be supplemented by breakthroughs in weather information, especially long-range forecasts or seasonal outlooks. This study, and the following study on corn, will help researchers better understand the effects of erratic rainfall.
Effects of erratic rainfall on corn
Erratic rainfall can also result in uncertainty in the management of nutrients applied as fertilizer in corn crops. Excessive rain can cause nitrogen fertilizer to leach, or move down through the soil away from plants. During the writing of this article, flooding occurred in corn fields at the LSU AgCenter Macon Ridge Research Station (Figure 5). Research trials implementing precision agriculture technology were conducted at AgCenter research stations from 2022 to 2024 to address flooding in soybeans and corn and were funded by the Louisiana Soybean and Grain Research and Promotion Board. The study investigated the impact of flooding on stand counts in soybeans and evaluated the vulnerability of nitrogen management in corn in excessive moisture conditions.
The corn flooding study found that corn yield was significantly reduced when excessive moisture followed the application of nitrogen fertilizer at the Red River Research Station site in Bossier City. That was not the case at the Doyle Chamber Central Research Station in Baton Rouge. A detailed analysis at the Baton Rouge site suggested that excessive moisture made the corn crop less economically viable. The excessive moisture reduced the Economically Optimum Nitrogen Rate (EONR), which is the fertilizer application rate that will allow the highest amount of profit for the crop. A higher amount of nitrogen was needed to achieve an attainable yield, which resulted in a lower maximum net return to nitrogen, a measurement that marks the point where the last pound of nitrogen applied to a crop is paid for by the last bushel of the crop that is produced.
Next steps
Weather anomalies are recurring risks that threaten the profitability of soybean and corn growers in Louisiana. This underscores the need for improved insurance protection, optimized planting time, better seasonal forecasting and enhanced predictive modeling and assessments to strengthen readiness and reduce future losses. These studies are among the first steps in understanding these weather anomalies.
Tri Setiyono is an assistant professor in the LSU AgCenter School of Plant, Environmental and Soil Sciences. Aakriti Poudel is a research associate in the School of Plant, Environmental and Soil Sciences. Carol Pinnell-Alison is an LSU AgCenter Franklin Parish Extension agent. David Moseley is an associate professor at the AgCenter Dean Lee Research and Extension Center in Alexandria.
This article appears in the summer 2026 edition of Louisiana Agriculture.
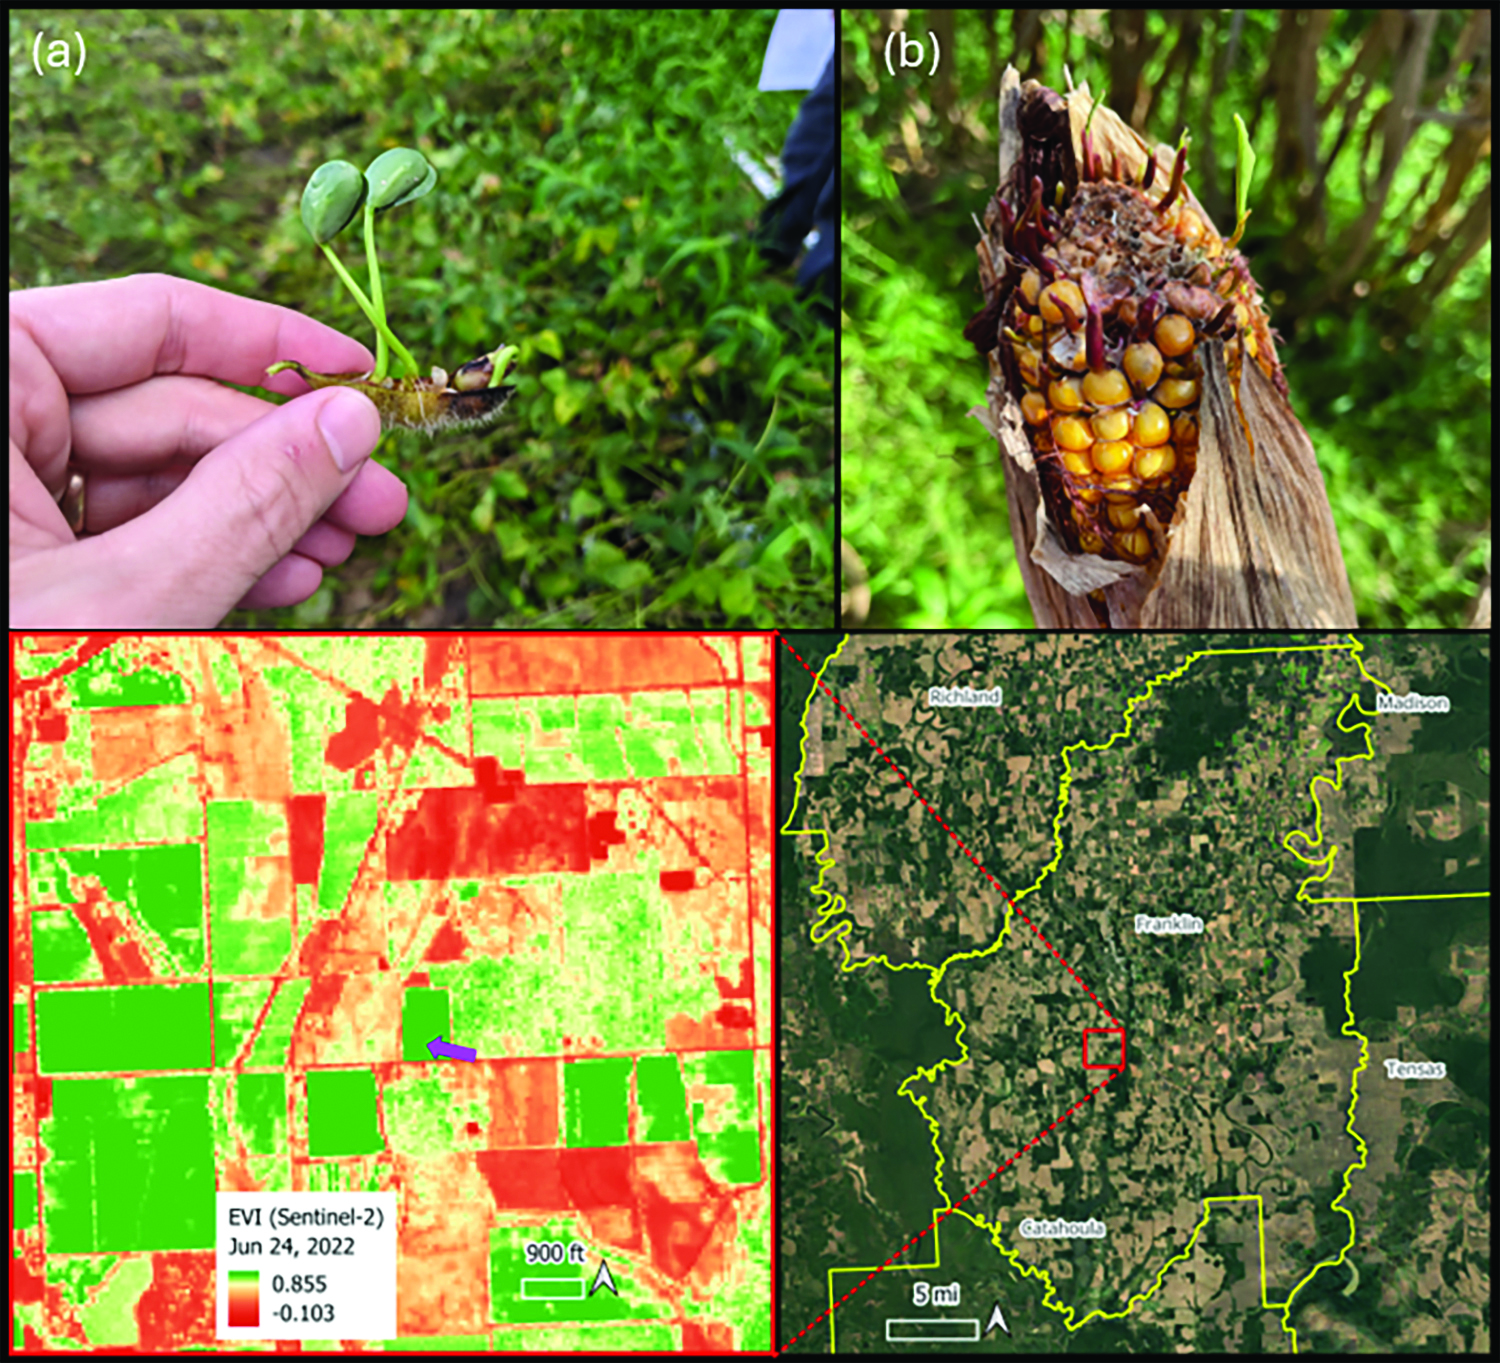
Figure 1. (a) Soybean seeds sprout in the pod. Photo by David Moseley. (b) Corn seeds sprout while still on the cob. Photo by Carol Pinnell-Alison. (c) The location of the soybean field is shown by the purple arrow in the accompanying map. The Enhanced Vegetation Index color gradient toward green indicates a high vegetatively active crop canopy coverage, whereas yellow to red indicates either more exposed bare soil or non-vegetatively active crop cover such as mature crops. (d) The overview of the location of the left map.

Figure 2. Monthly rain in 2022 reported by the LSU AgCenter Weather Station at the Sweet Potato Research Station near Winnsboro. Figure by Tri Setiyono

Figure 3. Map of Standard Precipitation Index (SPI) for Louisiana for August 2022 (a) and 2024 (b). Notice the excessive moisture extended across northeast Louisiana in 2022. The SPI for August 2024 represents normal conditions. The color gradient toward blue indicates high SPI or wet conditions, whereas yellow toward red indicates normal to dry conditions. SPI is a simple numerical score that shows how much rain a specific place has received compared to its normal historical average. Figure by Tri Setiyono